Working with Data? Think Curiosity Over Closure
Watch the Recording Listen to the Podcast
Educators have more and more data to manage and analyze. Yet, sometimes, the analysis is cut and dry, absent deeper examination that could raise critical questions and lead to innovation.
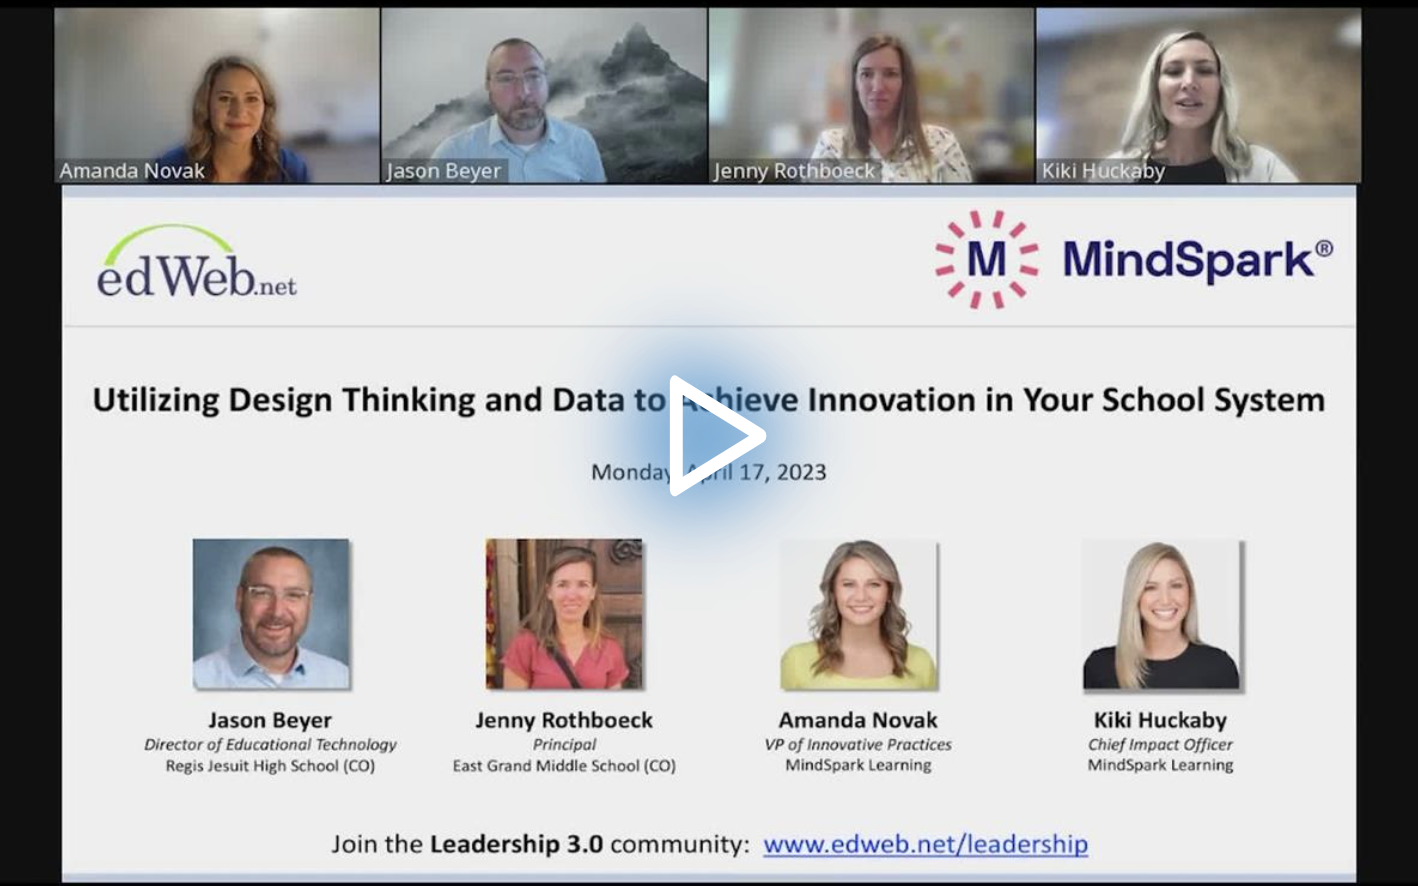
To bring purpose and meaning to data, explained education administrators in the edLeader Panel, “Utilizing Design Thinking and Data to Achieve Innovation in Your School System,” use a design-thinking mindset and curiosity to leverage actionable data that stimulate change, expedite growth, and disrupt systems.
A design-thinking mindset is essential. Data exploration involves looking more closely at the variables data present, asking thoughtful discovery questions, revisiting those questions as more information emerges, and identifying what is extreme and mainstream to recognize the audience range and what is doable in terms of solutions, etc., all part of an iterative process.
Thinking About Meaningful Data
Educators typically analyze data given to them—the results of state exams or school culture and climate surveys, for example—that offer a broad, standard, and cumulative view of learners, schools, and districts.
Moving from the “closure” that standard “big” data typically provide (numbers that tend to confirm or deny a bias, perspective, or hypothesis), educators’ curiosity can be at the heart of data collection and analysis. Teachers might consider seeking data to find answers to specific questions they want to explore. Asking about something to satisfy curiosity is more likely to effect change toward disruption.
So, next time you look at data, do so in an innovative light. Ask yourself a few essential questions: What stories do the data tell? Do the numbers help schools address specific gaps or needs? Do they inform the design or replication of effective programming? Do the data lead to critical questions and wonderings about the state of teaching and learning?
Consider how the numbers allow for a contextualized and localized viewpoint when analyzing data. For example, if national performance data indicate your school is high performing, those numbers should have you wondering: What is the school doing better than other schools? What could we do better? What systems and processes can be replicated? What are other high-performing schools doing that your school could do?
Venture into qualitative, anecdotal data (less academic, more socio-emotional) that invite a deeper understanding of students and other stakeholders, what takes place in school, instructional impact, etc.
Identify data biases that might affect students and impede their ability to reach their full potential. Maybe what the data indicate is different from what students are experiencing. Ask questions to determine the root cause of an issue (moving away from a focus on the symptoms): Are systems at play? Are there cultural disconnects? Are social dynamics an influence?
Gathering and Analyzing Data Toward Design
It’s critical to be intentional about the types of data gathered and how questions are structured, especially when internally investigating systems. The goal is to analyze within an action-oriented systems-thinking process to identify gaps, needs, etc., to uncover root causes.
Also essential is reviewing data from a human-centric lens to undertake responsive and interactive design. It is critical, when doing this work, to shift from designing solutions for the average person to thinking about extremes and how to prepare for what is outside of the status quo. For example, when looking at national trends, consider what is unique about your school, where it rests within the trends, and what is related to and outside of the school that can be addressed.
This is the process that Jason Beyer, Director of Educational Technology, Regis Jesuit High School (CO), and his team followed when his school explored trends related to gender and computer science education to take strategic action.
They first examined what was unique in their computer science programs to contextualize the national trends, underscoring how women fare in the field and where education contributes to industry barriers. For example, the data indicated the masculinization of the classroom, which heightens competition, and in households, where boys are more technologically engaged. Beyer explained that their school-based qualitative research showed the same.
“When it comes into our classroom,” shared Beyer, “it might appear as if males have an innate sense of their disposition toward computer science, but that’s not true. So, we had to unearth what classroom myths were and then figure out how to structure the classroom to demystify those myths.”
Beyer noted that this work would be simple in an educational setting. But what the school had to “disrupt” was outside of the classroom: promoting an understanding among parents about the value of the field to women, ensuring the counseling system prompted students to consider a computer science career, and revisiting the curriculum to put more emphasis on computer science through greater social orientation and collaborative group projects.
Most important: Each year, the school culture is examined to determine its stance on a specific discipline to address national, international, and local data.
Ultimately, urged Beyer, the data should give the school permission to investigate. “We use data to not only see the questions we need to be asking,” he explained, “but to see if those questions are hitting our classroom. And then address those root causes, whether they are in the classroom at the desk or behind the scenes culturally with our parents, with our school system, etc.”
Keep in mind the following as well when gathering and analyzing data:
- Clean data to fix or remove incorrect or duplicate data, even incorrectly formatted. This is important to get at the “truth” of what the numbers tell you, enabling you to pull out what is relevant to your goals.
- Use data for storytelling. Don’t just talk about the numbers; use them to advocate for change.
Collaboration
Beyer shared that deeper data analysis requires collaborative, strategic partnerships to effect change. When exploring solutions to address a root cause, consider the continuum of players and their unique perspectives to engage them in a systemic process. Highlight opportunities that data uncover to arrive at reasonable solutions that help in the classroom.
Employ regular feedback loops toward agile transformation. Have conversations with staff to gain insight, hold collaborative grade-level meetings with teachers, and build trusting relationships to gather honest, actionable feedback. Administer year-end climate and culture surveys that reveal essential data that inform approach and direction.
Data can sometimes dehumanize systems. However, data storytelling and analysis in that context can center the humans we work with and put them first genuinely and authentically, arriving at innovative and meaningful solutions.
Learn more about this edWeb broadcast, “Utilizing Design Thinking and Data to Achieve Innovation in Your School System,” sponsored by MindSpark Learning.
Watch the Recording Listen to the Podcast
Join the Community
Leadership 3.0: Essential Skills for Innovative Leaders is a free professional learning community where school and district leaders collaborate on innovative strategies to help teachers grow professionally, advance student learning, and improve communications with all stakeholders.
MindSpark is an innovative organization that believes in the power of education to solve society’s most pressing problems. Their programs deliver cutting-edge professional development experiences for educators, industry partners, and communities, enabling them to take their newly acquired skills back to the classroom and beyond. Since 2017, MindSpark has made an enormous impact, reaching almost 38K professionals and over 1.8M students worldwide. The organization has established meaningful relationships with more than 1000 industry and community partners, serving all 50 states and 88 countries. MindSpark’s programs are designed to bridge the gap between the most highly impacted regions and the leading edge regions, ensuring that everyone has access to the best possible educational resources. By empowering educators and communities with the tools they need to succeed, MindSpark hopes to create a brighter future for all.
Blog post by Michele Israel, based on this edLeader Panel.


Comments are closed.